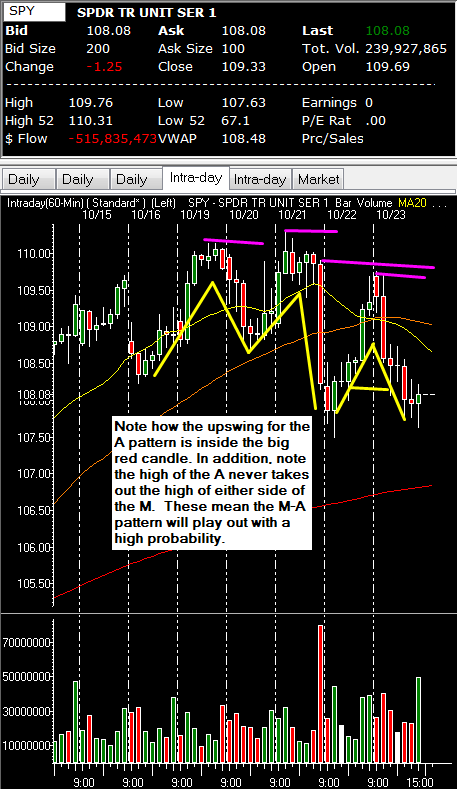
The key to the M-A pattern is to see the formation and recognize what makes it in play and what negates it. This M-A pattern played out for the prime reason that key rules were never broken. We will unveil this to you all so in the future you may profit off this pattern. The M-A pattern is a classic bearish pattern that signals downside. Knowing this would have told you that the markets were going to fall today. The first key comes in the form of the right side of the M pattern. Note how the left high of the M was at $110.13 on the SPY. Then please take note that the right side of the M pattern was at $110.34. The first rule to an M-A pattern is that the right side of the M should be higher than the left. This clearly is the case and tells any market technician that this could be an M-A pattern in play. Next, please note that as the rally happens and the upswing of the A forms, the high of that A cannot take out the right or left side of the M pattern. In addition, note that the upswing of the A never takes out the big red down candle on the 60 minute candle. Therefore, that entire upswing is considered inside candles do the big red down candle. This means that it is still categorized as an in spirit of bear flag. Because all these keys were in place, this M-A pattern had a high probability of working out. Sure enough, as the master level was hit, the A pattern drop occurred and the market sold hard. Learn these patterns, make the money!
#1. Note the right side of the M is higher than the left.
#2: Note the high of the A does not take out the high of the right or left side of the M.
#3: Note the move up in the A pattern, is all inside the big down candle on the 60 minute.


 Threaded Mode
